

















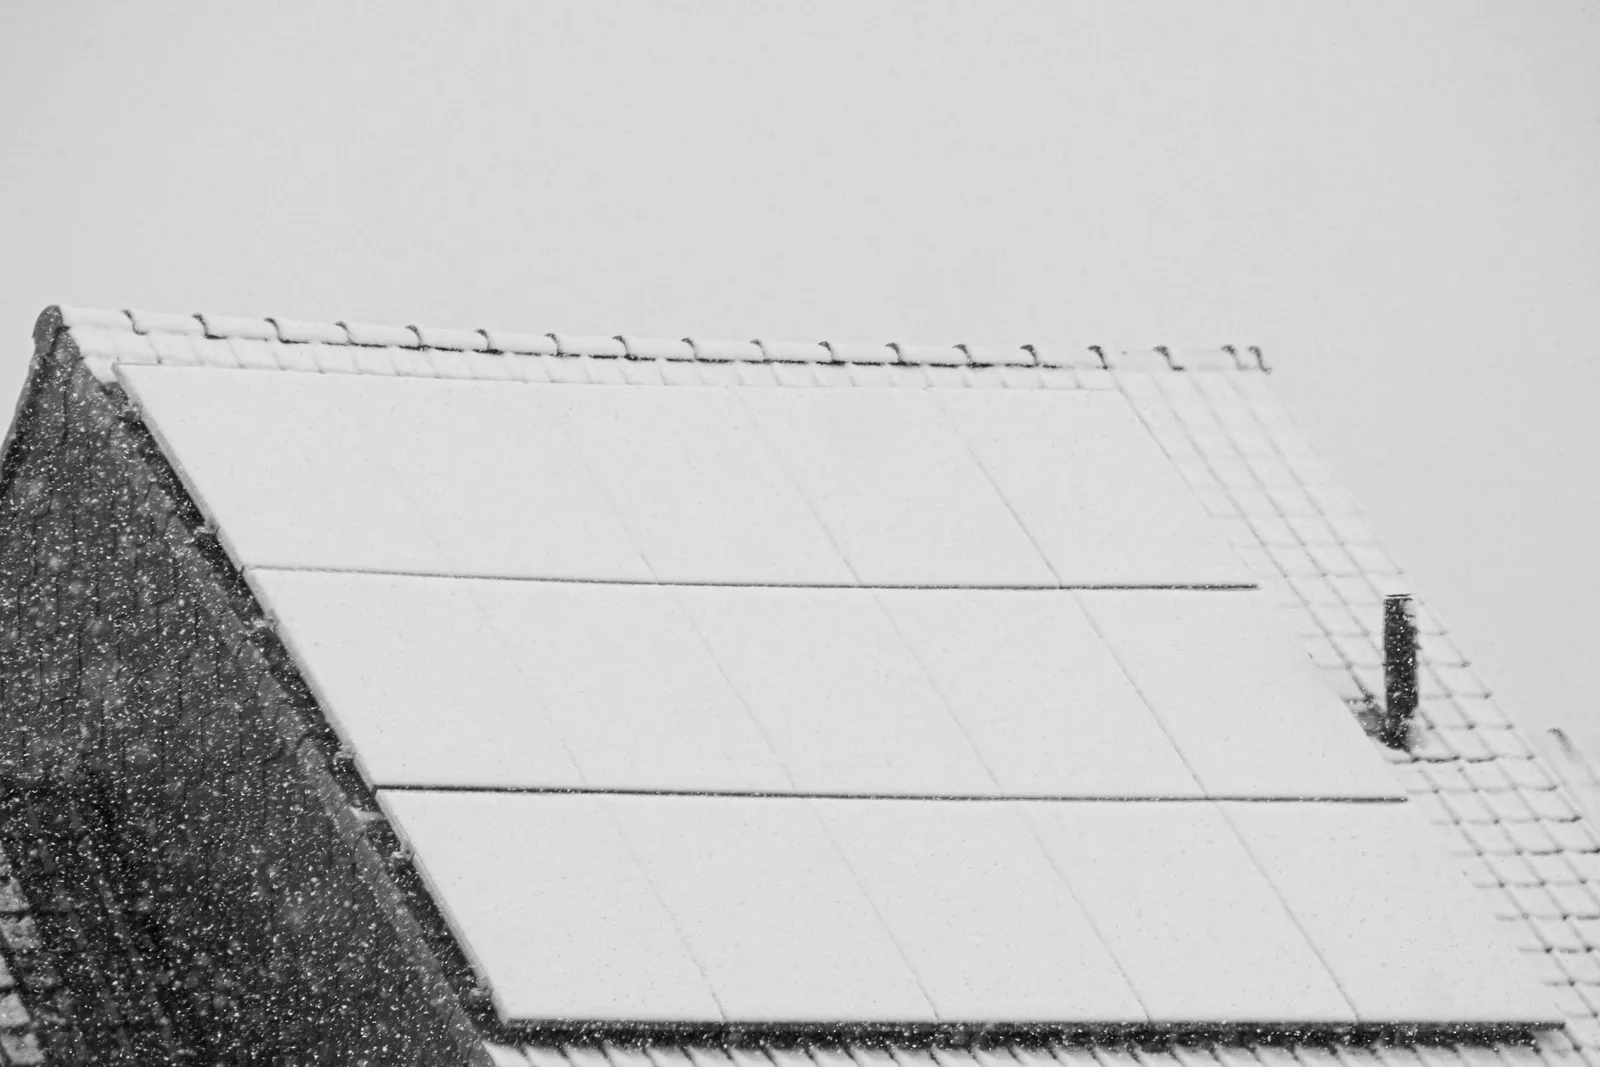
If you went solar this year, your first winter bill is going to look wrong. It isn’t. Your panels will make about half of an average month’s power in December, and in Seattle closer to a third.
Nothing broke. The sun just stopped working full shifts.
Here’s what they don’t tell you on the sales call. If your proposal shows one “average monthly savings” figure, that’s a yearly number divided by twelve. No month is average. Summer overdelivers, winter underdelivers, and the brochure quotes the midpoint.
We wanted real numbers, so we ran PVWatts, the free solar model run by the Department of Energy’s National Laboratory of the Rockies. Same setup everywhere: an 8 kW system on a south-facing roof at a 20-degree tilt, default losses, the lab’s typical-weather year.
Chicago makes 1,265 kWh in July and 459 in December. That’s about a third of July, and 53% of the average month.
Seattle goes from 1,147 to 265. December there is 37% of an average month.
Boston drops from 1,142 to 471. Phoenix barely flinches: 933 in December against a May peak of 1,438, about 80% of its average month.
Now put money on it. At the EIA’s August 2026 average residential prices, the modeled Chicago system is worth about $169 in an average month and about $89 in December. That’s roughly $80 less than the “monthly savings” you were quoted, and it happens every December. In Boston, where power runs 30.48 cents a kilowatt-hour, the December gap is about $121. Seattle’s is about $67, and Phoenix’s about $36.
Those numbers assume every kilowatt-hour is worth the full retail price. If your utility credits exports for less, the dollars shrink, but the shape doesn’t.
Verdict: not a defect, and not a reason to call anyone. Budgeting your winter bills off the yearly average, though, is dumb math.
Do this before December. Open the PVWatts calculator, enter your address, system size, tilt and direction, and write down the expected number for every month. Or dig out the monthly table in your installer’s proposal, if it has one. That’s your baseline now, not July.
Then check each month against its own month. Landing near the December estimate means it’s the season. A day at zero, or one section of the array flat while the rest keeps its normal curve, is a fault. That one is worth a service call, and the same shape test applies to a dark summer month.
Check your bill for the banked credit balance too. Under annual netting, summer surplus can carry December, until your true-up date, when some utilities wipe the leftover credits.
Still shopping? Ask every installer for the month-by-month estimate, not the annual one, and run it against our solar calculator and the cost breakdown in our solar hub.
PVWatts uses a typical year, not this year. A cloudy December will come in under it, a clear one over it. The gap between July and December, though, is set by the tilt of the planet, and no installer can sell you out of that.
How Candid Yak makes money. Some of the products we write about pay us if you apply or sign up through our links. That never changes our verdict, our rankings, or the numbers in this article. We call a bad deal a bad deal whether it pays us or not. Some brands shown in our comparison tools are placeholder examples while we finalize partner agreements, and we label them as such.
Sources
- PVWatts Calculator (National Laboratory of the Rockies, U.S. Department of Energy)
- PVWatts V8 API documentation (National Laboratory of the Rockies). Candid Yak model runs on October 26, 2026: 8 kW, fixed roof mount, 180-degree azimuth, 20-degree tilt, 14% losses, NSRDB typical meteorological year
- Table 5.6.A. Average Price of Electricity to Ultimate Customers by End-Use Sector, by State, August 2026 and 2025 (U.S. Energy Information Administration, Electric Power Monthly)