










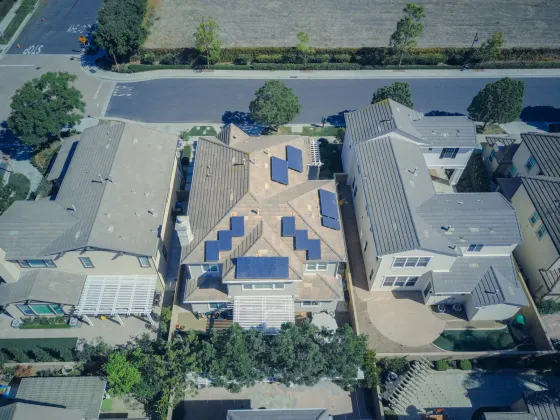






You are not using more electricity. You are paying more for the same electricity.
That is the entire story of your power bill between now and 2027, and the federal government just put numbers on it.
The Energy Information Administration published its Short-Term Energy Outlook on September 9. The U.S. average residential price was 17.30 cents per kilowatt-hour in 2025. The forecast puts it at 18.20 cents this year and 18.59 cents in 2027.
Now the part nobody quotes. In the same tables, average residential usage per customer runs 10,479 kWh in 2025, 10,487 in 2026, and 10,465 in 2027. Flat, then slightly down.
Do the arithmetic on the average household. About $1,813 a year in 2025. About $1,945 in 2027. You pay roughly $133 more for 14 fewer kilowatt-hours.
That’s a price increase wearing a utility bill as a costume.
Here’s where it gets useful, because the national number is a blend and you don’t live in a blend. Middle Atlantic customers, meaning New York, New Jersey and Pennsylvania, go from 22.70 cents to 25.36 cents by 2027. That’s up 11.7%. East North Central, meaning Ohio, Indiana, Illinois, Michigan and Wisconsin, goes from 17.70 to 19.71 cents, up 11.4%.
New England? Up 3.4%. West North Central, the Plains states, up 3.4%.
So the fastest increases are not landing on the expensive coasts. They’re landing on the Mid-Atlantic and the industrial Midwest, two regions where rooftop solar has never been the obvious move because the rates were middling.
Middling rates are what’s changing.
This matters because solar payback runs on one input above all others: the price of the power you stop buying. Not the size of the array, not the brochure, not the 25-year savings total on page nine. The cents per kilowatt-hour you avoid. An Ohio homeowner looking at a quote that pencils at 17.70 cents is looking at stale math if the same kilowatt-hour is headed to 19.71.
And watch for the inverse mistake. A quote that assumes your household will burn more power every year is sizing an array for a home you don’t have. The federal forecast says average usage goes nowhere. If a salesperson builds consumption growth into the model to make the system look better, make them show you why yours grows when the national number doesn’t.
Rooftop output keeps climbing through all of this. The same outlook has residential small-scale solar generation going from 63 billion kWh in 2025 to 70 this year to 76 in 2027, up about 21% in two years.
Do this before you take another solar call. Pull your last twelve electric bills. Add up the dollars, add up the kilowatt-hours, divide. That quotient is your real rate, taxes and fixed charges and all, and it is almost never the number on the utility’s rate card.
Then run it. Our solar calculator takes your actual rate and your actual usage instead of a regional average, and the rest of our solar coverage is there when you want the financing side. If you already have a quote in hand, make them re-run it at your number and show you both versions.
Your rate is going up. Whether that makes solar worth it is still your call, and it is a different call in Toledo than it is in Hartford.
How Candid Yak makes money. Some of the products we write about pay us if you apply or sign up through our links. That never changes our verdict, our rankings, or the numbers in this article. We call a bad deal a bad deal whether it pays us or not. Some brands shown in our comparison tools are placeholder examples while we finalize partner agreements, and we label them as such.